
Managers need reports to get an overview over costs, to analyze production processes, and to identify problems.
Reports are the basis for keeping a focus on production figures, shift reports, error messages, and other developments in production or logistics processes. The data for these reports are usually collected in various IT systems. Our reporting tool RGRID enables companies to bring together data from various data silos and to provide all relevant key figures automatically and time-controlled. RGRID is a practical tool for medium sized companies.
RGRID provides custom-tailored and predefined tables and spreadsheets, when you need them and in the format that you want. It hands you transparency and control over your data and processes.
- RGRID creates lists and tables from your various databases and combines that data into a single file.
- The results will be displayed in a file format that you need or define: TXT, PDF, HTML, CSV, XLS(X), XML, or JSON.
- You define the layout so that it fits your purpose best. The design can be adapted to your needs.
- RGRID is a web-based reporting tool. The web frontend is based on HTML5. It displays the data and it lets you research the data.
- Alternatively, RGRID delivers the reports to you on schedule: per email, short messaging service, or as live-stream to a screen, enabling you to always keep an eye on your current production process.
Here are some practical examples what you can do with RGRID
- Automatically generate reports as spreadsheeets
- Combine data from various processes and sources into one big picture
- Receive precise results for output figures
- Edit production figures in connection with other data
- Recognize deviations from production standards fast and automatically send messages to take care of the problem
- Avoid the typical Excel chaos
RGRID is an elegant solution to bring together data from all relevant systems automatically and to deliver reports based on events or an a time schedule. You can completely automate standard evaluations.
Your advantages:
- 360 degree view: RGRID combines data from various systems in one web-based dashboard.
- Comfort: RGRID sends out reports based on events or on a time schedule.
- Usability: Working with RGRID is easy.
- Role and rights management: You decide who is permitted to access data using the built-in authorization concept.
- Data processing: You can assign different data processing rights.
Contact us to find out more about our data delivery service RGRID. We are happy to provide more information and to discuss what this tool can do for you.

Our software CREMA is the basis to integrate with your IT or an existing solution for Enterprise Resource Planning. It can be used to process and display information from all kinds of sources like production, logistics, and IT in real time.
All CREMA building blocks can be combined:
- Digitized order control in real time
- Simple integration with an existing solution for Enterprise Resource Planning
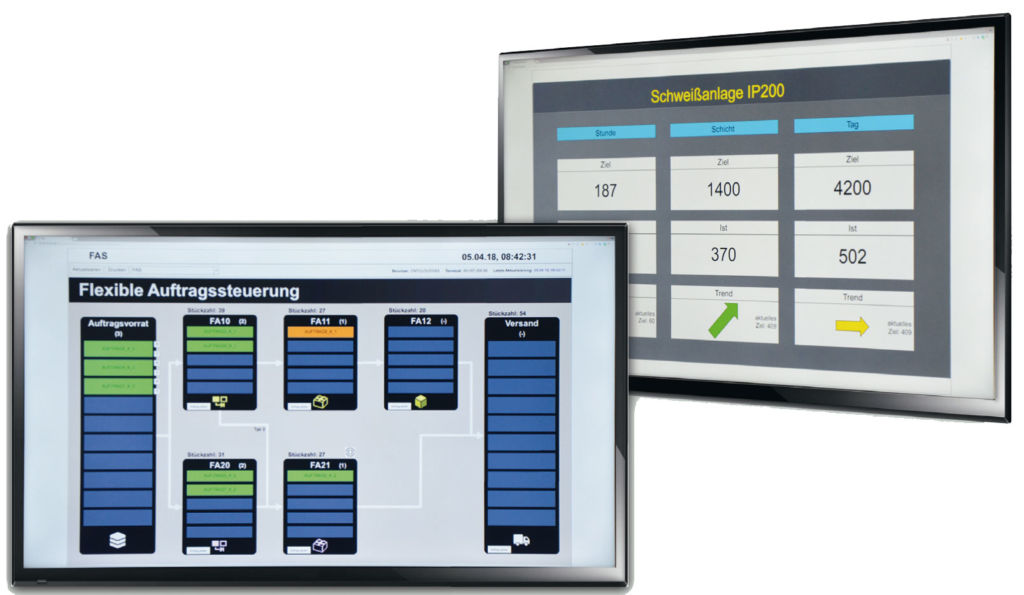
- Progress along the production line and the logistic chain as a live depiction shown on screens, ANDON panels, or mobile devices like smartphones or notebooks
- Electronic documentation of production parameters
- Progress and status, trending graphs in real time
- Automatic collection of actual figures from production, logistics, and quality, feeding the data back to the ERP system
- Userdefined integration of all participants in a process
- Direct connection to a mobile app or online shop
 Your advantages:
- Simple, modular design that can be extended
- Intelligent, low maintenance sensors
- Ease of use and individual screen design
- Your processes – easily and quickly digitized
- Integrate employees in production and logistics with easy, interactive applications
- Fast digital “Wow effect”
- Optimizing your ability to deliver and your customer satisfaction
- Increase productivity and quality
- Custom fit, economical solution
Real time – Your new Productive Factor!


